

For this article, I want to introduce a piece of software I've actually used recently in my own work. My new day job involves studying the ionosphere using an instrument called an ionosonde. This device is basically a giant radio transmitter that bounces radio waves off the ionosphere to see its structure and composition. Obviously, an important part of this is knowing the radiation pattern of the various transmitters and receivers.
Several methods exist for modeling the electromagnetic fields around conductors, but here I'm covering one called NEC2 (Numerical Electromagnetics Code). It originally was developed in FORTRAN at the Lawrence Livermore National Laboratory in the 1970s. Since then, it's been re-implemented several times in various languages. Specifically, let's look at xnec2c. This package implements NEC2 in C, and it also provides a GTK front end for interacting with the core engine.
xnec2c should be available in most Linux distributions. In Debian-based distributions, you can install it with the command:
sudo apt-get install xnec2c
Once it's installed, you can start it with xnec2c. The
default display doesn't show anything until you actually start using it.
Figure 1. Launching xnec2c gives you a pretty boring starting point.
xnec2c's history still affects how it behaves to the present day. This is most clear when you look at the input file's format. The basic structure is based on the idea of a punch card, where each "command" to xnec2c is given by a command card—a definite holdover from its FORTRAN roots. Luckily, the GTK front end to xnec2c provides a reasonably functional way of building up these input files.
Several example files should be available with your installation of xnec2c. In my Ubuntu distribution, they're located in /usr/share/doc/xnec2c/examples. These input files have a filename ending of ".nec". Select one as a starting off point to play with xnec2c, and then go ahead and make the required alterations necessary for your own project.
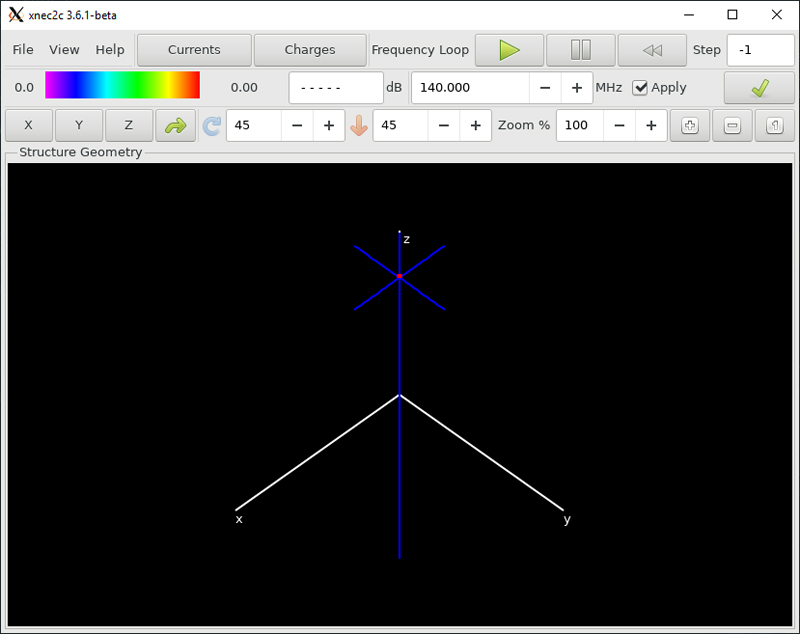
Figure 2. Loading an input file, you begin with a geometric view of relevant antenna wires, other conductors and any ground planes.
The central window pane provides a geometric view of the actual antenna structure in three dimensions. You can click and drag the diagram to rotate the view and see it from all angles. There are two larger buttons at the top of the window, named Currents and Charges. Selecting them alternately will show either the distribution of currents or the distribution of charges caused by the driving current.
Once you're sure the physical layout is correct, you can start to see what the electromagnetic behavior of the system looks like. On the menu bar at the top, there is an entry named View. Clicking "Radiation Pattern" pops up a new window where you can view what the electromagnetic radiation pattern looks like. A few different options are available. The first, "Gain Pattern", provides what most people probably think of as the radiation pattern.
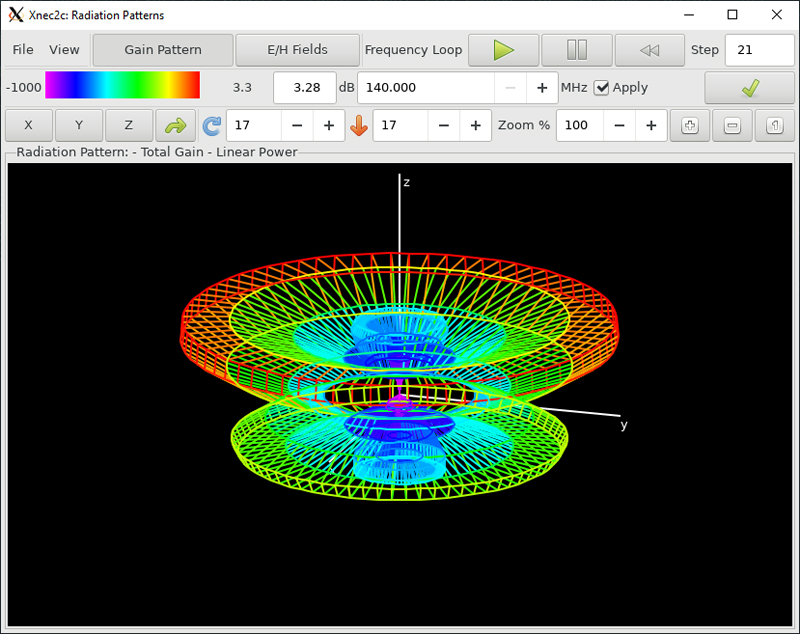
Figure 3. You easily can model the radiation pattern from an antenna system.
Again, you can click and drag the image to get a better view of the pattern from various angles.
In the same window, there is a second display option. Assuming your input file has the appropriate entries, click the "E/H Fields" button to see a view of the electric and/or magnetic fields for your configuration.
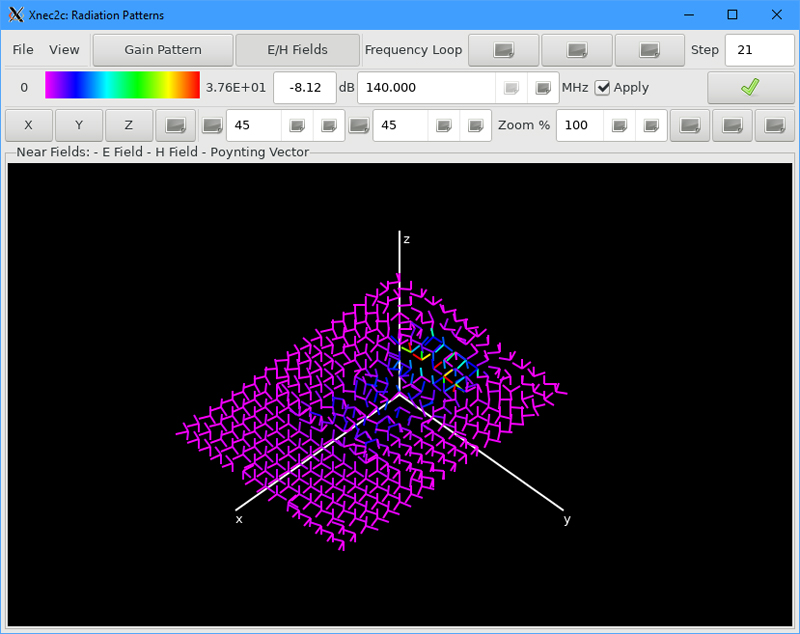
Figure 4. If your input file has the appropriate entries, you can see a display of electric and magnetic fields.
Several options are available at the top of the window. For example, you can change the frequency of the driving current to see how your system behaves at different frequencies.
The second major display that's available shows how your antenna design behaves over a series of driving frequencies. Clicking View→Frequency Plots pops up a new window.
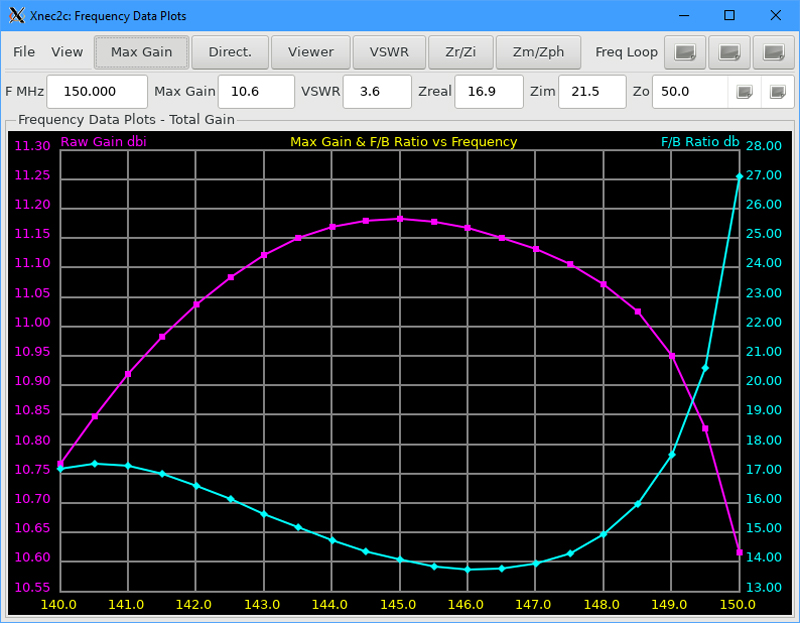
Figure 5. You can get several detailed plots of the electrical behavior of your antenna design.
The first button shows you how the gain changes over a given frequency sweep. Clicking on each subsequent button adds a new graph to the same window. For example, click the VSWR button to see how the Voltage Standing Wave Ratio (VSWR) changes over frequency.
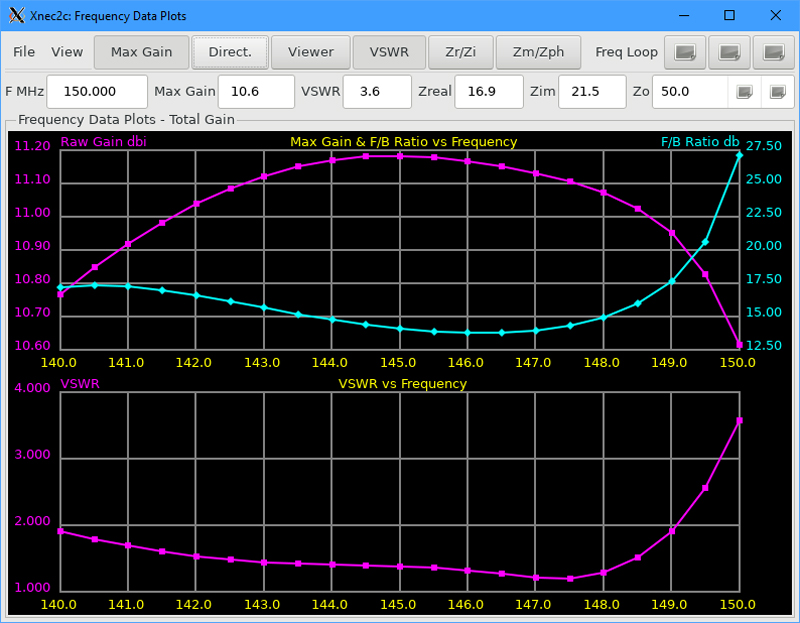
Figure 6. You can see multiple plots of the electrical behavior stacked on top of each other to get a better overall view of your antenna configuration.
You probably will need to resize the window if you want to view more than a couple graphs simultaneously. As with the E/H Fields plot from earlier, whether these plots behave as you expect depends on the input file you're using.
The example files provide a great place to start, but they're not likely to match your situation exactly. In those cases, you'll want to edit the input files to configure the system exactly as you need it to be.
Although you simply can open the input file in any text editor, xnec2c includes an edit function built in. Clicking the File→Edit menu item pops open a new window where you can see all of the input cards.
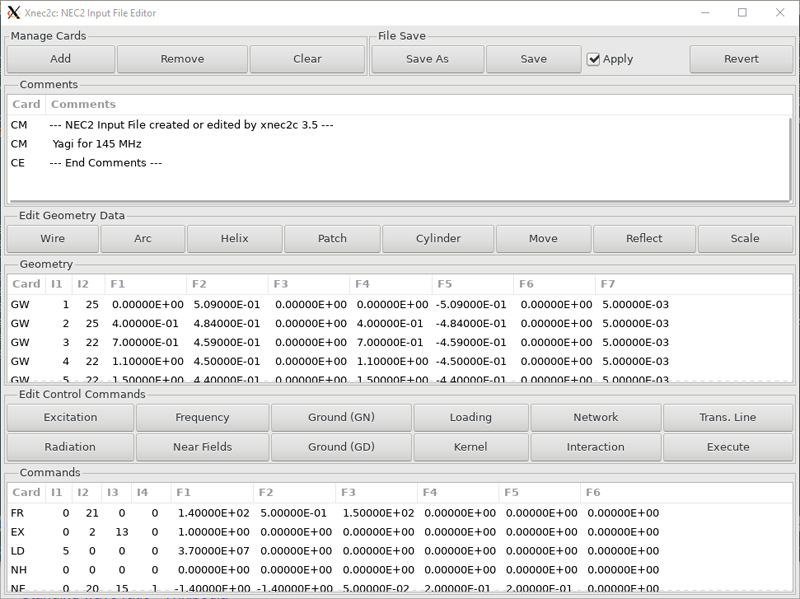
Figure 7. You can use the built-in editor to customize the input file to your personal specifications.
You can change the values for already existent cards, but the best feature of this editor is that you can add new cards with the click of a button. If you are new to NEC2 and its input format, you may not necessarily remember the codes and formats for the various types of input cards. The editor window helps with this. There even are buttons, like mirror and scale, that aid in the design phase by taking advantage of symmetries you may have in your antenna.
In each of these displays, you have a couple different options when it comes to saving your results. The simplest is clicking File→Save As. This lets you save the resulting image as a PNG file. If you select File→Save As gnuplot, the actual data is exported into a file, and the format is appropriate for the type of data that you might want to feed into gnuplot. This way, you can tailor the resulting graphical display for your particular situation.
Results that xnec2c generates are not directly comparable with those from other implementations of NEC2. Its focus is more on the functionality of being interactive. If you want more traditional output, you can use xnec2c to view your antenna configuration, and then use nec2c to generate your final results.
—Joey Bernard