

Ibrahim tests the performance of three open-source webservers on a typical Ericsson Research Linux clusterplatform.
ARIES (Advanced Research on Internet E-Servers) is a project that started at Ericsson Research Canada in January 2000. It aimed at finding and prototyping the necessary technology to prove the feasibility of a clustered internet server that demonstrates telecom-grade characteristics using Linux and open-source software as the base technology.
The telecom-grade requirements for clustered internet Linux servers are very strict and well recognized within the telecommunications industry. These characteristics include a combination of guaranteed availability (guaranteed 24/7 access), guaranteed response time (statistically guaranteed delays), guaranteed scalability (large-scale linear scalability) and guaranteed performance (to serve a minimum number of transactions per second).
In addition, telecom-grade internet servers have other important requirements to meet, such as the capability to cope with the explosive growth of internet traffic (growing at over 100% every six months) as well as meeting the increased quality of service demanded by the end users, not to mention very strict security levels.
These internet servers necessitate a high-performance and highly scalable web server. Since all of the work in ARIES is based on open-source software, we needed an open-source web server that could help us build our targeted system.
One of our goals in ARIES is to be able to build an internet server capable of scaling to thousands of concurrent users without download speeds noticeably slowing. This type of scalability is best accomplished when application servers are hosted on a group or cluster of servers. When a request for a particular page of a web site comes in, that request is routed to the least busy server (using a smart and efficient traffic distribution solution, either hardware- or software-based).
We decided to experiment with three web servers: Apache, Jigsaw and Tomcat. Apache is the world's most popular web server. We have been experimenting with it since ARIES first started in 2000. Jigsaw, a Java-based web server, is currently used on our experimental Linux cluster platform. Tomcat, another Java-based web server, is a potential replacement to Jigsaw if proven to be a better performer.
The Apache web server is a powerful, flexible, HTTP/1.1-compliant web server. According to Netcraft Web Servers' survey, Apache has been the most popular web server on the Internet since April 1996. This comes as no surprise because of its many characteristics, such as the ability to run on various platforms, its reliability, robustness, configurability and the fact that it provides full source code with an unrestrictive license. For our tests, we have experimented with Apache 1.3.14, which was the stable release at the time, and the Apache 2.08 alpha release (2.08a).
Jigsaw is W3C's open-source project that started in May 1996. It is a web server platform that provides a sample HTTP 1.1 implementation and a variety of other features on top of an advanced architecture implemented in Java. Jigsaw was designed to be a technology demonstration to experiment new technologies rather than a full-fledged release. For our tests, we used Jigsaw 2.0.1 (serving HTTP requests on port 8001) in conjunction with the Java 2 SDK.
Tomcat is the reference implementation for the Java Servlet 2.2 and JavaServer Pages 1.1 technologies. Tomcat, developed under the Apache license, is a servlet container, a runtime shell that manages and invokes servlets on behalf of users, with a JSP environment.
Tomcat can be used either as a standalone server or as an add-on to an existing web server such as Apache. For our testing, we installed Tomcat 3.1 as a standalone server, servicing requests on port 8080.
For the purpose of testing and evaluating the above-mentioned web servers, we set up a typical Ericsson Research Linux cluster platform (see Figure 1).
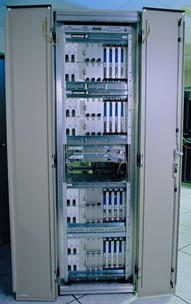
Figure 1. Ericsson Research Typical Linux Cluster
This platform is targeted for carrier-class server applications. The testing environment consisted of:
Eight diskless Pentium III CompactPCI CPU cards running at 500MHz and powered with 512MB of RAM. The CPUs have two onboard Ethernet ports and are paired with a four-port ZNYX Ethernet card providing a high level of network availability.
Eight CPUs with the same configuration as the others except that each of these CPUs has a disk bank. The disk bank consists of three 18GB SCSI disks configured with RAID 1 and RAID 5 to provide high data availability.
Master Nodes: two of the CPUs (with disks) act as redundant NFS, NTP, DHCP and TFTP servers for the other CPUs. The code for NFS redundancy was developed internally along with a special mount program to allow the mounting of two NFS servers at the same mounting point.
When we start the CPUs, they boot from LAN (either LAN 1 or LAN 2 for higher availability in case either of the LANs go down). Then they broadcast a DHCP request to all addresses on the network. The master nodes will reply with a DHCP offer and will send the CPUs the information they need to configure network settings such as the IP addresses (one for each interface: eth0, eth1, znb0 and znb1), gateway, netmask, domain name, the IP addresses of the boot servers and the name of the boot file.
The diskless CPUs will then download and boot the specified boot file in the DHCP configuration file, which is a kernel image located under the /tftpboot directory on the DHCP server. Next, the CPUs will download a RAM disk and start the application servers, which are the Apache, Jigsaw and Tomcat web servers. The process of booting a diskless server takes less than one minute from the time it is booted until we get the login prompt.
As for the CPUs with disks, they will download and boot the specified boot file in the DHCP configuration file, which is a kernel image located under the /tftpboot directory on the DHCP server. Next, they will perform an automatic RAID setup and a customized install for Red Hat 6.2. When the CPUs are up, they will start Apache, Jigsaw and Tomcat web servers, each on a different port. The process of booting a disk server takes around five minutes from the time it is booted until we get the login prompt (which includes an automatic RAID 1 and RAID 5 setup, as well as a complete install from scratch for Red Hat 6.2).
For our testing, we were booting the disk CPUs (six of them, except the master nodes) as diskless CPUs so we could have an identical setup on many CPUs.
The performance of web servers and client-server systems depends on many factors: the client platform, client software, server platform, server software, network and network protocols. Most of the performance analysis of the Web has concentrated on two main issues: the overall network performance and the performance of web server software and platforms.
Our benchmarks consist of a mechanism to generate a controlled stream of web requests with standard metrics to report results. We used 16 Intel Celeron 500MHz 1U rackmount units (see Figure 2) that come with 512MB of RAM and run Windows NT. These machines generate traffic using WebBench, a Freeware tool available from www.zdnet.com.
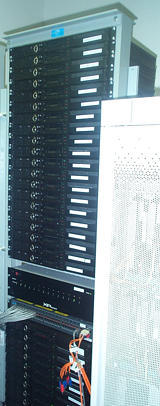
Figure 2. Benchmarking Units
The basic benchmark scenario is a set of client programs (loaf generators) that emit a stream of web requests and measure the system response. The stream of requests is called the workload. WebBench provides a way to measure the performance of web servers. It consists of one controller and many clients (see Figure 3). The controller provides means to set up, start, stop and monitor the WebBench tests. It is also responsible for gathering and analyzing the data reported from the clients.

Figure 3. Architecture of WebBench
On the other hand, the clients execute the WebBench tests and send requests to the server. WebBench uses the client PCs to simulate web browsers. However, unlike actual browsers, the clients do not display the files that the server sends in response to their requests. Instead, when a client receives a response from the server, it records the information associated with the response and then immediately sends another request to the server.
There are several measurements of web servers. For our testing, we will report the number of connections or requests served per second and throughput, the number of served bytes per second (see Figure 4).
WebBench uses a standard workload tree to benchmark the server. The workload tree comes as a compressed file that we need to move to the server and expand in the HTML document root on the web server (this is where the web server looks for its HTML files). This will create a directory called WBTREE that contains 61MB of web documents that will be requested by the WebBench clients. Since some of our CPUs are diskless, we installed the workload tree on the NFS server and modified the web server configuration to use the NFS directory as its document root.
As part of WebBench configuration, we specified that the traffic generated by the benchmarking machines would be distributed equally among the targeted CPUs. Figure 5 shows how we specify each server node and the percentage of the traffic it will receive.
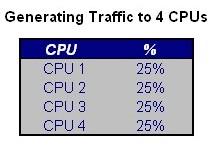
Figure 5. Sample WebBench Configuration
After setting our Linux cluster and the benchmarking environment, we were ready to define our test cases. We tested all of the three web servers (Apache both 1.3.14 and 2.08a, Tomcat 3.1 and Jigsaw 2.0.1) running on 1, 2, 4, 6, 8, 10 and 12 CPUs. For every test case, we would specify in the RAM disk loaded by the CPUs which web server to start when the RAM disk is loaded. As a result, we ran four types of tests, each with a different server and on multiple CPUs.
For the purpose of this article, we will only show three comparison cases: Apache 1.3.14 vs. Apache 2.08a on one CPU, Apache 1.3.14 vs. Apache 2.08a on eight CPUs and Jigsaw 2.0.1 vs. Tomcat 3.1 on one CPU.
The first benchmark we did was to test all the web servers on one CPU. In WebBench configuration, we specified that all the traffic generated by all the clients be directed to one CPU. Figure 6 shows the results of the benchmark for up to 64 simultaneous clients. On average, Apache 1.3.14 was able to serve 828 requests per second vs. 846 requests per second serviced by Apache 2.08a. The latest showed a performance improvement of 2.1%.
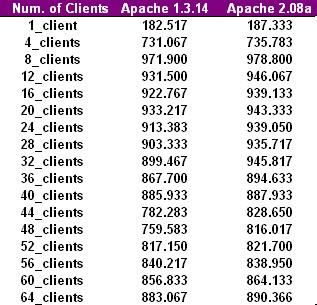
Figure 6. Apache 1.3.14/2.08a Benchmarking Data on One CPU
Figure 7 plots the results of the benchmarks of Apache 1.3.14 and Apache 2.08a. As we can see, both servers have almost identical performance.
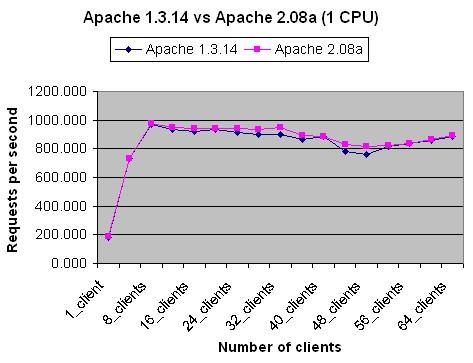
Figure 7. Apache 1.3.14/Apache 2.08a Benchmarking Results on One CPU
As for the Java-based web servers, Tomcat and Jigsaw, Figures 8 and 9 show the resulting benchmarking data. The maximum number of requests per second Jigsaw was able to achieve was 39 vs. 60 for Tomcat. We were surprised by Jigsaw's performance; however, we need to remember that Jigsaw was designed to experiment new technologies rather than as a high-performance web server for industrial deployment.
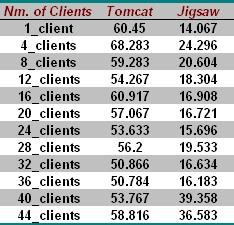
Figure 8. Tomcat/Jigsaw Benchmarking Data on One CPU
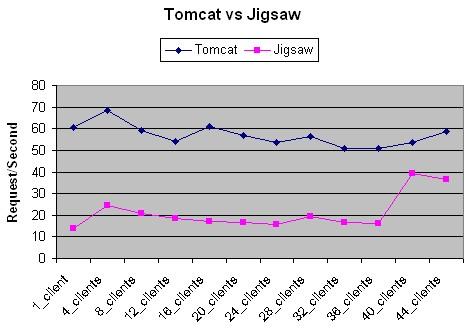
Figure 9. Tomcat/Jigsaw Benchmarking Results on One CPU
When we scale the test over eight CPUs, Apache 2.08a was more consistent in its performance, servicing more requests per second as we increased the number of concurrent clients without any fluctuations in the number of serviced requests (see Figure 10).
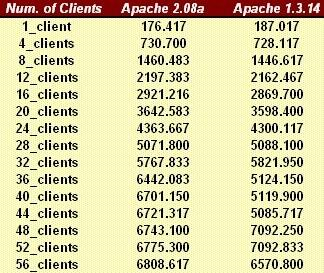
Figure 10. Apache 2.08a/Apache 1.3.14 Benchmarking Data on Eight CPUs
Figure 11 clearly shows how consistent Apache 2.08a is compared to Apache 1.3.14. On eight CPUs, Apache 2.08a was able to maintain an average of 4,434 requests per second vs. 4,152 for Apache 1.3.14, a 6.8% performance improvement.
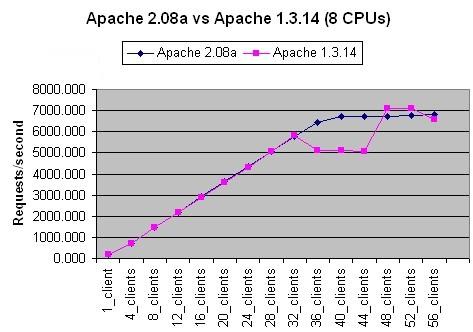
Figure 11. Apache 2.08a/Apache 1.3.14 Benchmarking Results on Eight CPUs
We collected graphs for systems with 1, 2, 4, 6, 8, 10 and 12 Linux processors. For each graph, we recorded the maximum number of requests per second that each configuration can service. When we divide this number by the number of Linux processors, we get the maximum number of requests that each processor can process per second in each configuration.
Figures 12 and 13 show the transaction capability per processor plotted against the cluster size for both versions of Apache. In both figures the line is not flat, which means that the scalability is not linear, i.e., not optimum.
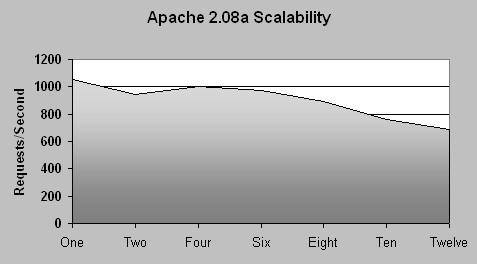
Figure 12. Apache 2.08a Scalability Chart
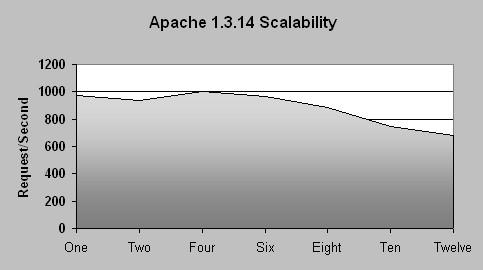
Figure 13. Apache 1.3.14 Scalability Chart
If we collect the scalability data of Apache 1.3.14 and 2.08a (see Figure 14) and create the corresponding graph, Figure 15, we observe that both servers have similar scalability compared to each other.
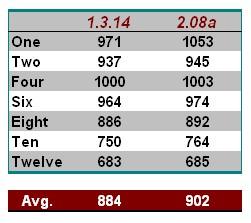
Figure 14. Scalability Data Comparison
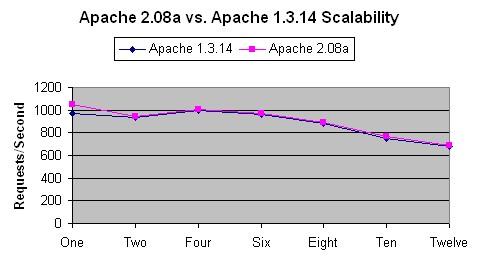
Figure 15. Apache 1.3.14 vs. 2.08a Scalability
On Linux systems both versions of the server have similar scalability. According to our results, Apache 2.08a is around 2% more scalable than the 1.3.14 version. In either case, we have a slow linear decrease. The more CPUs we add after we reach eight CPUs, the less performance we get per CPU.
As for the Java-based web server, although Tomcat showed a better performance (servicing more requests per second) than Jigsaw, it showed a slight scalability problem. Figure 16 shows a slight decrease in performance per processors as we add more processors.
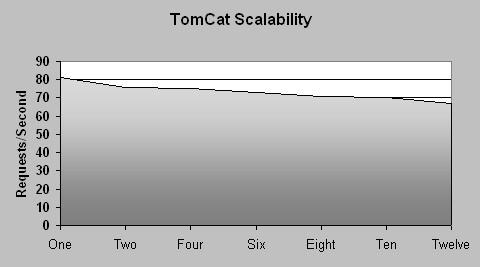
Figure 16. Tomcat Scalability Chart
Nonetheless, there are many possible explanations for the scalability degradation with the addition of more processors.
Several factors could have affected the results of the benchmarking tests:
We used NFS to store the workload tree of WebBench to make it available for all the CPUs. This could present a bottleneck at the NFS level when hundreds of clients per second are trying to access NFS-stored files.
Jigsaw and Tomcat are Java-based web servers, and thus their performance depends much on the performance of the Java Virtual Machine, which is also started from an NFS partition (since the CPUs are diskless and share I/O space through NFS).
To generate Web traffic, we were limited to only 16 Celeron rackmount units. The generated traffic may not have been enough to saturate the CPUs, especially in the case of Apache when we were testing more than six CPUs.
During our work on this activity, we faced many problems ranging from hardware problems and working on prototyped hardware to software problems, such as supported drivers and devices. In this section, we will focus only on the problems we faced while completing our benchmarks.
We suffered stability problems with the ZNYX Ethernet Linux drivers. The drivers were still under development; they were not production-level yet. After reaching a high number of transactions per second, the driver would simply crash. The following is a sample benchmark on one CPU running Apache 2.08a. Once the CPU reaches the level of servicing 1,053 requests per second (throughput of 6,044,916 bytes per second), the Ethernet driver would crash and we would lose connectivity to the ZNYX ports (see Figure 17).
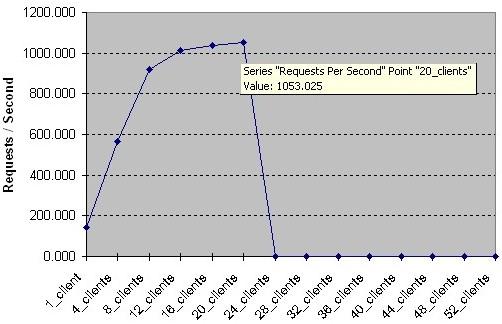
Figure 17. Ethernet Driver Crashing on High Load
We did much testing and debugging with the people from ZNYX and we were able to fix the driver problem and maintain a high level of throughput without any crash.
The second problem we faced when booting the cluster is related to inetd. The inetd dæmon acts as the operator for other system dæmons. It sits in the background and listens to network ports for incoming connections. When a connection is made, inetd spawns off a copy of the appropriate dæmon for that port. The problem we faced was that inetd was blocking for unknown reasons on UDP requests, and we needed to restart the dæmon every time it blocked. We are still having this problem even with the latest release of xinetd.
Another issue we faced was that we were not able to saturate the CPUs with enough traffic. That was obvious. We needed more power than what we were trying to benchmark. At the time we conducted this activity, we only had 17 machines deployed (one controller and 16 clients) for benchmarking purposes. It could be one reason why we were not able to scale up. However, we have increased the capacity of our benchmarking environment to 63 machines, and now we will be able to rerun some of the tests and verify our results.
ARIES started as a proof-of-concept project to study if we could build an internet server that has near telecom-grade characteristics using Linux and open-source software as the base technology. We have experimented with the various Linux distributions, web and streaming servers, traffic distribution and load-balancing schemes, distributed and journaling filesystems suitable for HA Linux clusters and redundancy solutions (NFS, Ethernet, Software RAID).
For the future, the work in ARIES will be directed toward augmenting the clustering capabilities of Linux to enable the system to accommodate more types of mobile internet services in addition to the already deployed web server applications looked at thus far. The focus will be to enable the system to reach the optimal utilization of the cluster's resources and to enhance the security aspects required within a mobile internet server. In addition, the project will augment the capabilities of the existing systems by supporting IPv6 technology.
We are keeping all three web servers on our experimental Linux cluster platform. The tested web servers did not scale linearly as we added more CPUs. However, they demonstrated very good performance and near-linear scalability (testing was limited to 12 CPUs). We are currently deploying the latest versions of Apache (2.0.15a), Jigsaw (2.2.0) and Tomcat (3.2).
Based on our tests, we believe that Apache has shown to be considerably faster and more stable than other web servers. We are looking forward to testing and experimenting with the 2.0 release version, which promises a clean code, a well-structured I/O layering and a much-enhanced scalability.
The author would like to acknowledge the Open Architecture Research Department at Ericsson Research for approving the publication of this article, as well as Marc Chatel and Evangeline Paquin, Ericsson Research Canada, for their help and contributions to the benchmarking activities.